Spectral leakage happens whenever we introduce components into the frequency spectrum of a signal. First, let's look at this in the case of continuous time with a continuous signal.
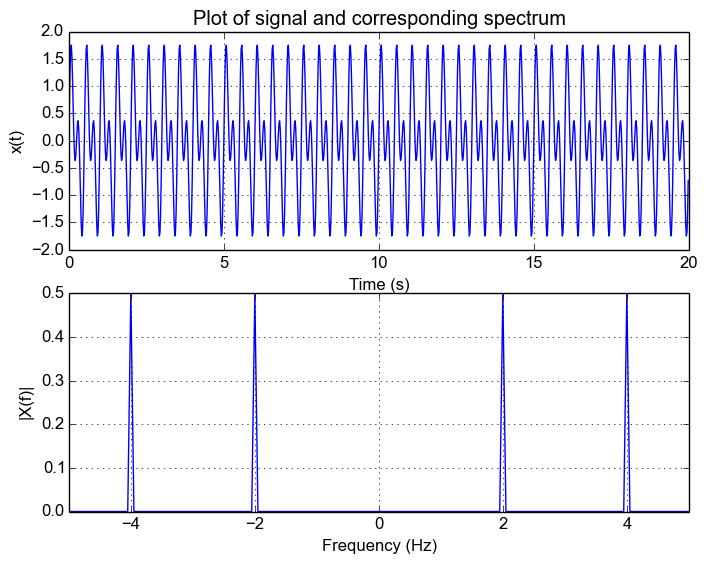
Let's say we have a simple sine wave of 2Hz,
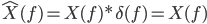
Its corresponding fourier transform is an impulse at both positive and negative frequency:
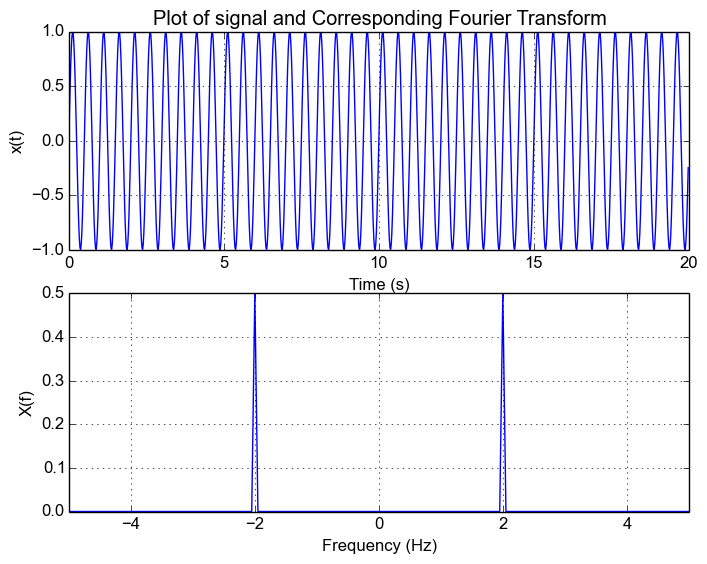
The following plots (assume it extends to infinity in time on both sides) show the signal and its corresponding spectrum:
Introducing Windowing
Now, in the case of a real signal, we're only going to have access to a window of the original signal. Let's define this window as  . This gives us the signal:
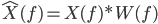
The corresponding Fourier Transform for this new signal is given by the multiplication/convolution theorem
Spectrum Leakage
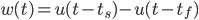
Now in the normal case, our window function is a rectangular function. Let's say we sample between  and
and  and
and  . This window function and corresponding Fourier Transform is

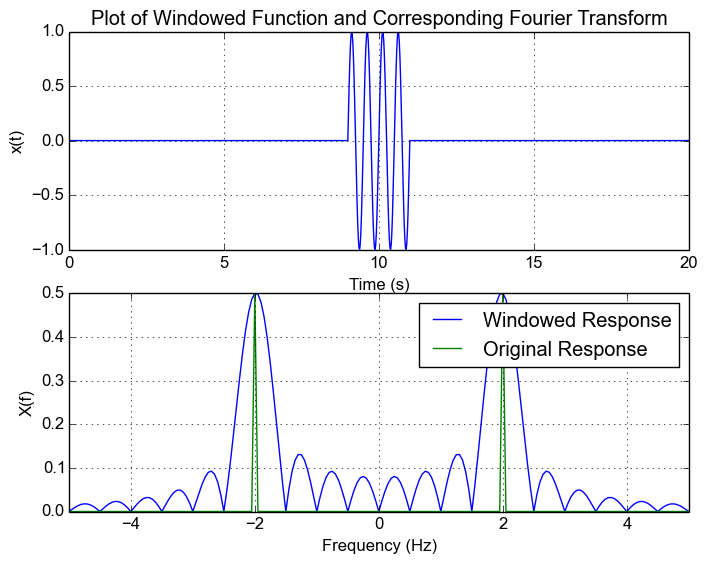
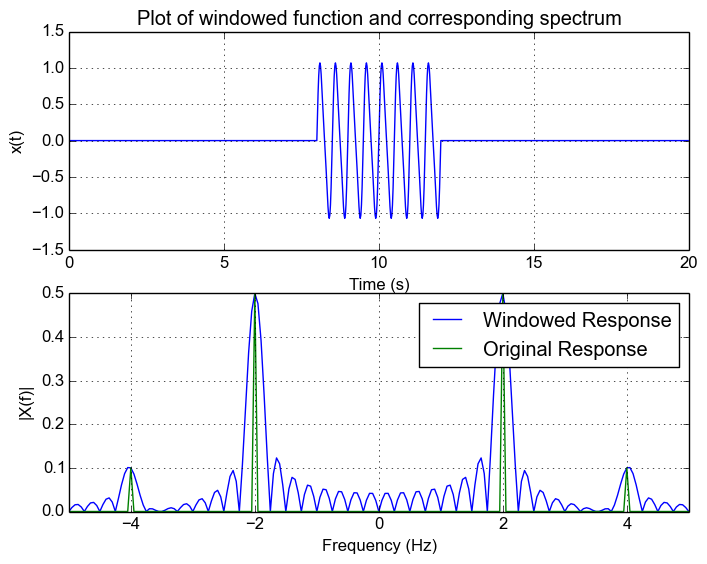
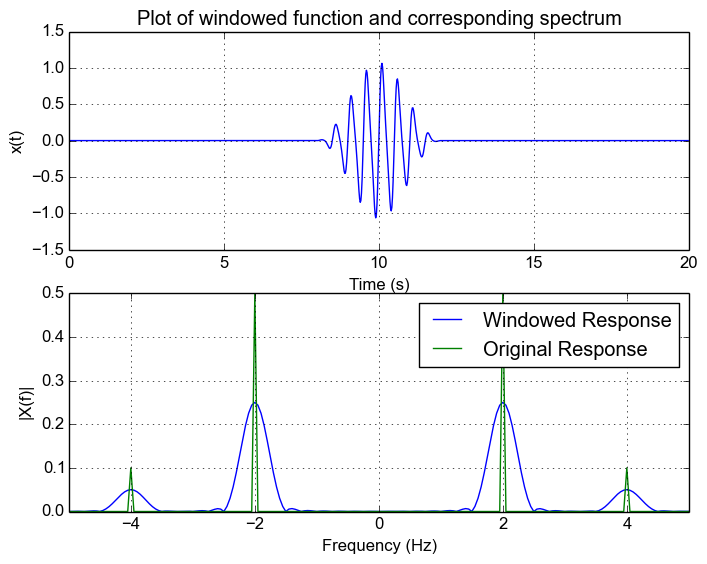
This is exactly what gives rise to spectral leakage. The rectangular window causes the spectrum to now be spread across other frequencies as well. Going back to the example signal, lets pick a random window from  , we get the following responses and we can see the leakage.
Window Response:

Windowed Response:
Note: In the case were our sample window extends to infinity, our window is  . The corresponding Fourier transform of the window
  . Plugging it back into our expected function for the windowed signal, we have
Effects of Spectrum Leakage
One of the main issues with spectrum leakage is that the leakage can cause smaller signals to be lost in the leakage caused by another signal.
To show this, let's add use a signal that has a tone at 2Hz and 4Hz:

The following figure shows the response of the result. We can see that we can still make out the 2Hz and 4Hz signal.
Now what happens when we scale down the amplitude of the 4Hz signal? We can see from the following figure that this results in the peak of the 4Hz signal not being as visible anymore on top of the leakage.
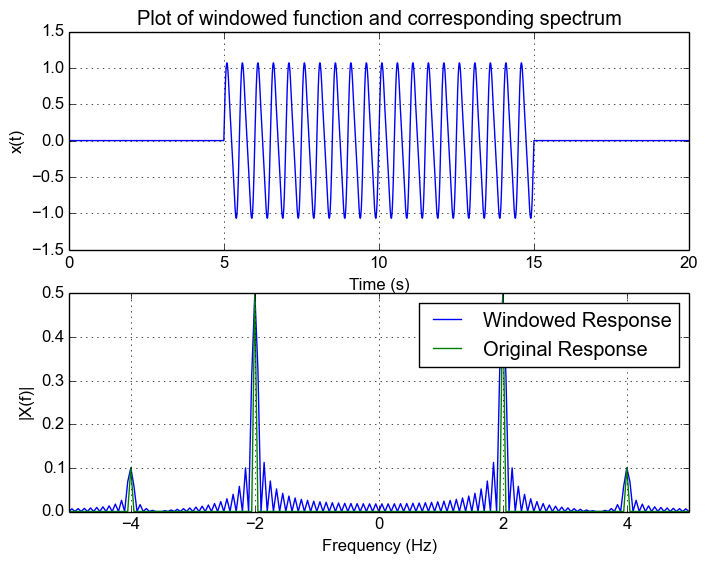
Note: In the case of rectangular function, if we increase the number of samples, we reduce the effects of leakage. Furthermore, as a general case, increasing the number of samples is the best way to decrease spectral leakage regardless of what kind of window you use.
Different Window Functions
Different functions are used in order to reduce how far out the leakage gets. There's a whole list of different functions and their characteristics on this Wikipedia page. I'm not going to go into what the different window functions are and how they affect the result, but the main thing to realize is that the frequency response of the window is convolved with the spectrum of the original signal. There is generally a trade-off between attention of side frequencies and the width of the main lobe.
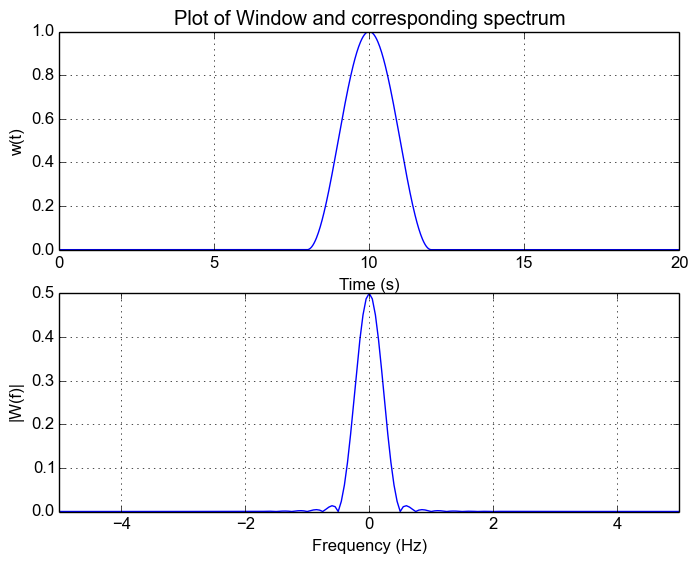
Let's use the Hanning window and see how it affects our result. For this example, I'm simply replacing the rectangular window with the Hanning window. The following shows the frequency response of the Hanning window. We can see how theres no ringing and it pretty much tapers off. But notice that the width of the main lobe has increased.
Now let's apply it to our signal with two frequency components. Note how we can now see the 4Hz signal! This is what using different windowing functions lets us achieve.
FFT/Discrete Fourier Transform
Now, in the real world we only have a discretely sampled signal. This doesn't affect our result very much. The real main difference we see is that the FFT essentially samples the frequency response, and that our frequency range is now limited to the sample rate.
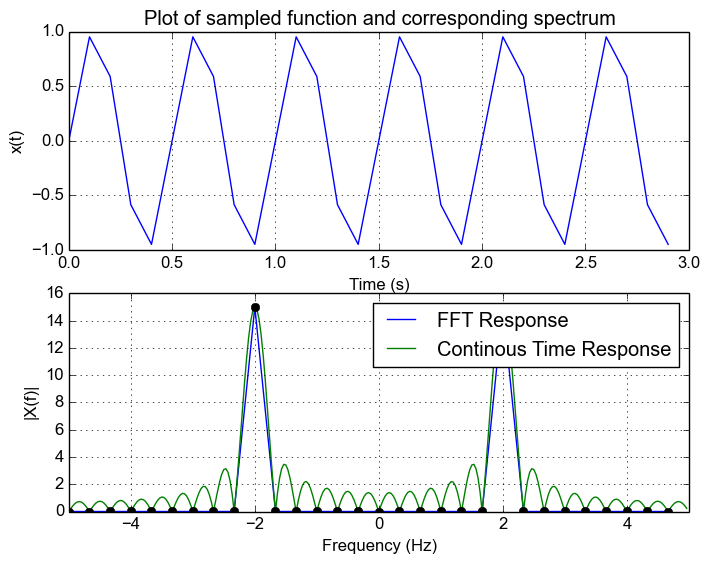
Let's say we now sample our original 2Hz signal and sample at 10Hz for 6 cycles (this is actually how I generated the initial plot), we can see that we get the same frequency response as in the original example. This is because at sampled frequencies of the rectangular window frequency response, the sampled values are zero. This is because The FFT essentially obtains a sampled version of the continuous response which we can see in the following plot.
Actually, if you zero-pad the signal you will actually see the FFT no longer looks like a spike and instead you will see the sinc response.This is because by zero padding your are increasing the resolution of the FFT and you will sample at non-integer points and see the behaviour.
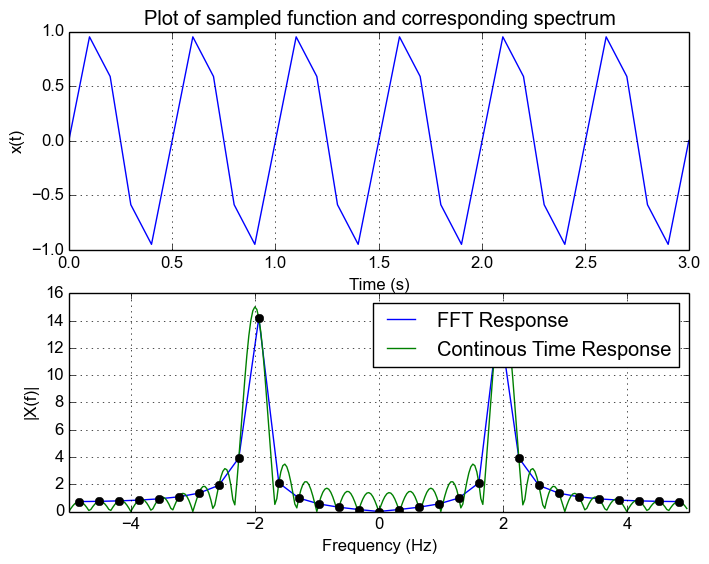
Now what happens when we don't have an integer number of samples? Let's say we sample for 6 cycles plus 1 sample. We can see that our FFT looks spread out. The underlying reason is that we're no longer sampling at the zero points in the freuqnecy response of the window and are now sampling part of the leakage caused by a rectangle function
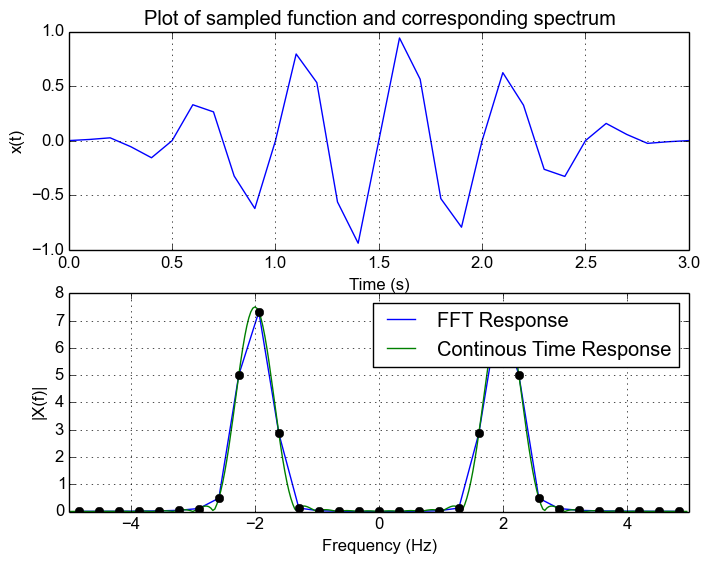
Now let's use the Hanning window. We can see that the leakage is reduced and FFT now looks more like a spike and is contained to a couple of nearby bins.
Conclusion
Spectrum leakage happens because of the window we use on our signal when we sample it. The window functions frequency response is convolved with the frequency response of the original signal. This window function introduces spectral leakage and the effect of the leakage depends on the window function.
For a discrete signal with appropriate sample rate such that there is no aliasing, the FFT is simply a discretely sampled continuous version of the band limited spectrum. As a result, leakage will occur when an FFT is computed of a signal sampled of a non-integer number of cycles.
Choosing an appropriate window will help get rid of this leakage and care must be chosen to see how it affects the spectrum.